
Zuto is one of the UK's leading car finance brokers, connecting customers with lenders across a complex, regulated financial services process. With thousands of customers moving through their journey each month, even small inefficiencies have a measurable impact on conversion, customer satisfaction, and operational cost.
This engagement was an 8-week service design sprint focused on diagnosing the health of Zuto's end-to-end car finance journey, identifying where the process was breaking down, and generating a clear set of opportunities for improvement. I joined a small cross-functional team as the sole service designer, working alongside a Transformation Director, two Principal Engineers, and a Delivery Manager.
My remit went well beyond the conventional boundaries of a design role. I led all workshop facilitation, built the service blueprints, ran quantitative analysis on over 20,000 customer experience data points, and created predictive modelling dashboards to project the impact of proposed changes. The work produced a strategic, evidence-based foundation for Zuto's service transformation.
Zuto's leadership understood that their end-to-end service had grown in complexity over time, but they lacked a comprehensive, joined-up view of how it actually operated. Different departments had deep knowledge of their own chapter of the journey, but no single team could see the full picture.
This fragmentation had real consequences. Pain points were known within silos but rarely escalated. Customer experience data existed but was not mapped to specific moments in the journey. There was no structured mechanism for connecting operational problems to business impact.
The core brief was to make the end-to-end service more efficient, with the ultimate aim of improving the rate at which customers successfully completed car finance applications. Within a regulated financial services context, this required careful attention to compliance boundaries, lender constraints, and the expectations of customers who may be unfamiliar or anxious about the finance process.
Key challenge: Turning fragmented departmental knowledge into a single, shared view of the service, then using that view to surface and validate opportunities for meaningful improvement.
As the only designer on the engagement, I was responsible for the full service design stream. This included designing and facilitating workshops, producing all design artefacts, conducting quantitative data analysis, and building dashboards to model and communicate findings.
Working within a financial services context required me to adapt my practice. Compliance considerations, data governance, and the nuances of regulated lending shaped how I framed problems, ran sessions with stakeholders, and presented opportunities. I worked closely with the Transformation Director to ensure that all outputs were grounded in what was realistic within Zuto's operational and regulatory environment.
The team structure meant I had significant autonomy over the design methods and tools I used. I worked across Miro for workshop facilitation and service mapping, Figma for visual design and artefact production, Excel and Claude for quantitative analysis, and built custom dashboards to communicate predictive insights to stakeholders unfamiliar with data-heavy outputs.
The engagement followed a structured, phased approach. Each phase built directly on the last, moving from broad discovery through to a detailed, evidenced set of opportunities and a forward plan for implementation.
The engagement opened with a two-day kick-off workshop, bringing together stakeholders from across Zuto's business for the first time in a structured design setting. I led the second day of the workshop entirely, facilitating a cross-departmental session focused on mapping Zuto's end-to-end service at a high level.
Getting multiple departments into the same room, often with different mental models of how the service worked, required careful session design. I structured the day around building a collaborative service blueprint, using facilitation techniques that encouraged participants to challenge assumptions and surface tensions they would not ordinarily raise in day-to-day operations. The output was a shared, high-level view of the end-to-end journey with an initial set of pain points identified from a top-level perspective.
Following the kick-off, I ran a series of focused workshops, one per chapter of the service journey. Each session brought in the key stakeholders most closely involved in that part of the process, allowing for a far more granular and honest conversation than the all-hands setting had permitted.
This bottom-up approach was deliberate. Where the kick-off surfaced the shape of the problem, the chapter sessions revealed the detail. Stakeholders who had never been asked to articulate their pain points in a structured format were able to map specific failure modes, workarounds, and knowledge gaps. I synthesised these findings across sessions to build a picture of where the most significant and most systemic issues sat within the journey.
Working within a financial services business added a layer of nuance here. Many pain points were intertwined with regulatory requirements or lender-imposed constraints, meaning the challenge was not simply to remove friction but to understand which friction was unavoidable and which was a symptom of process debt.
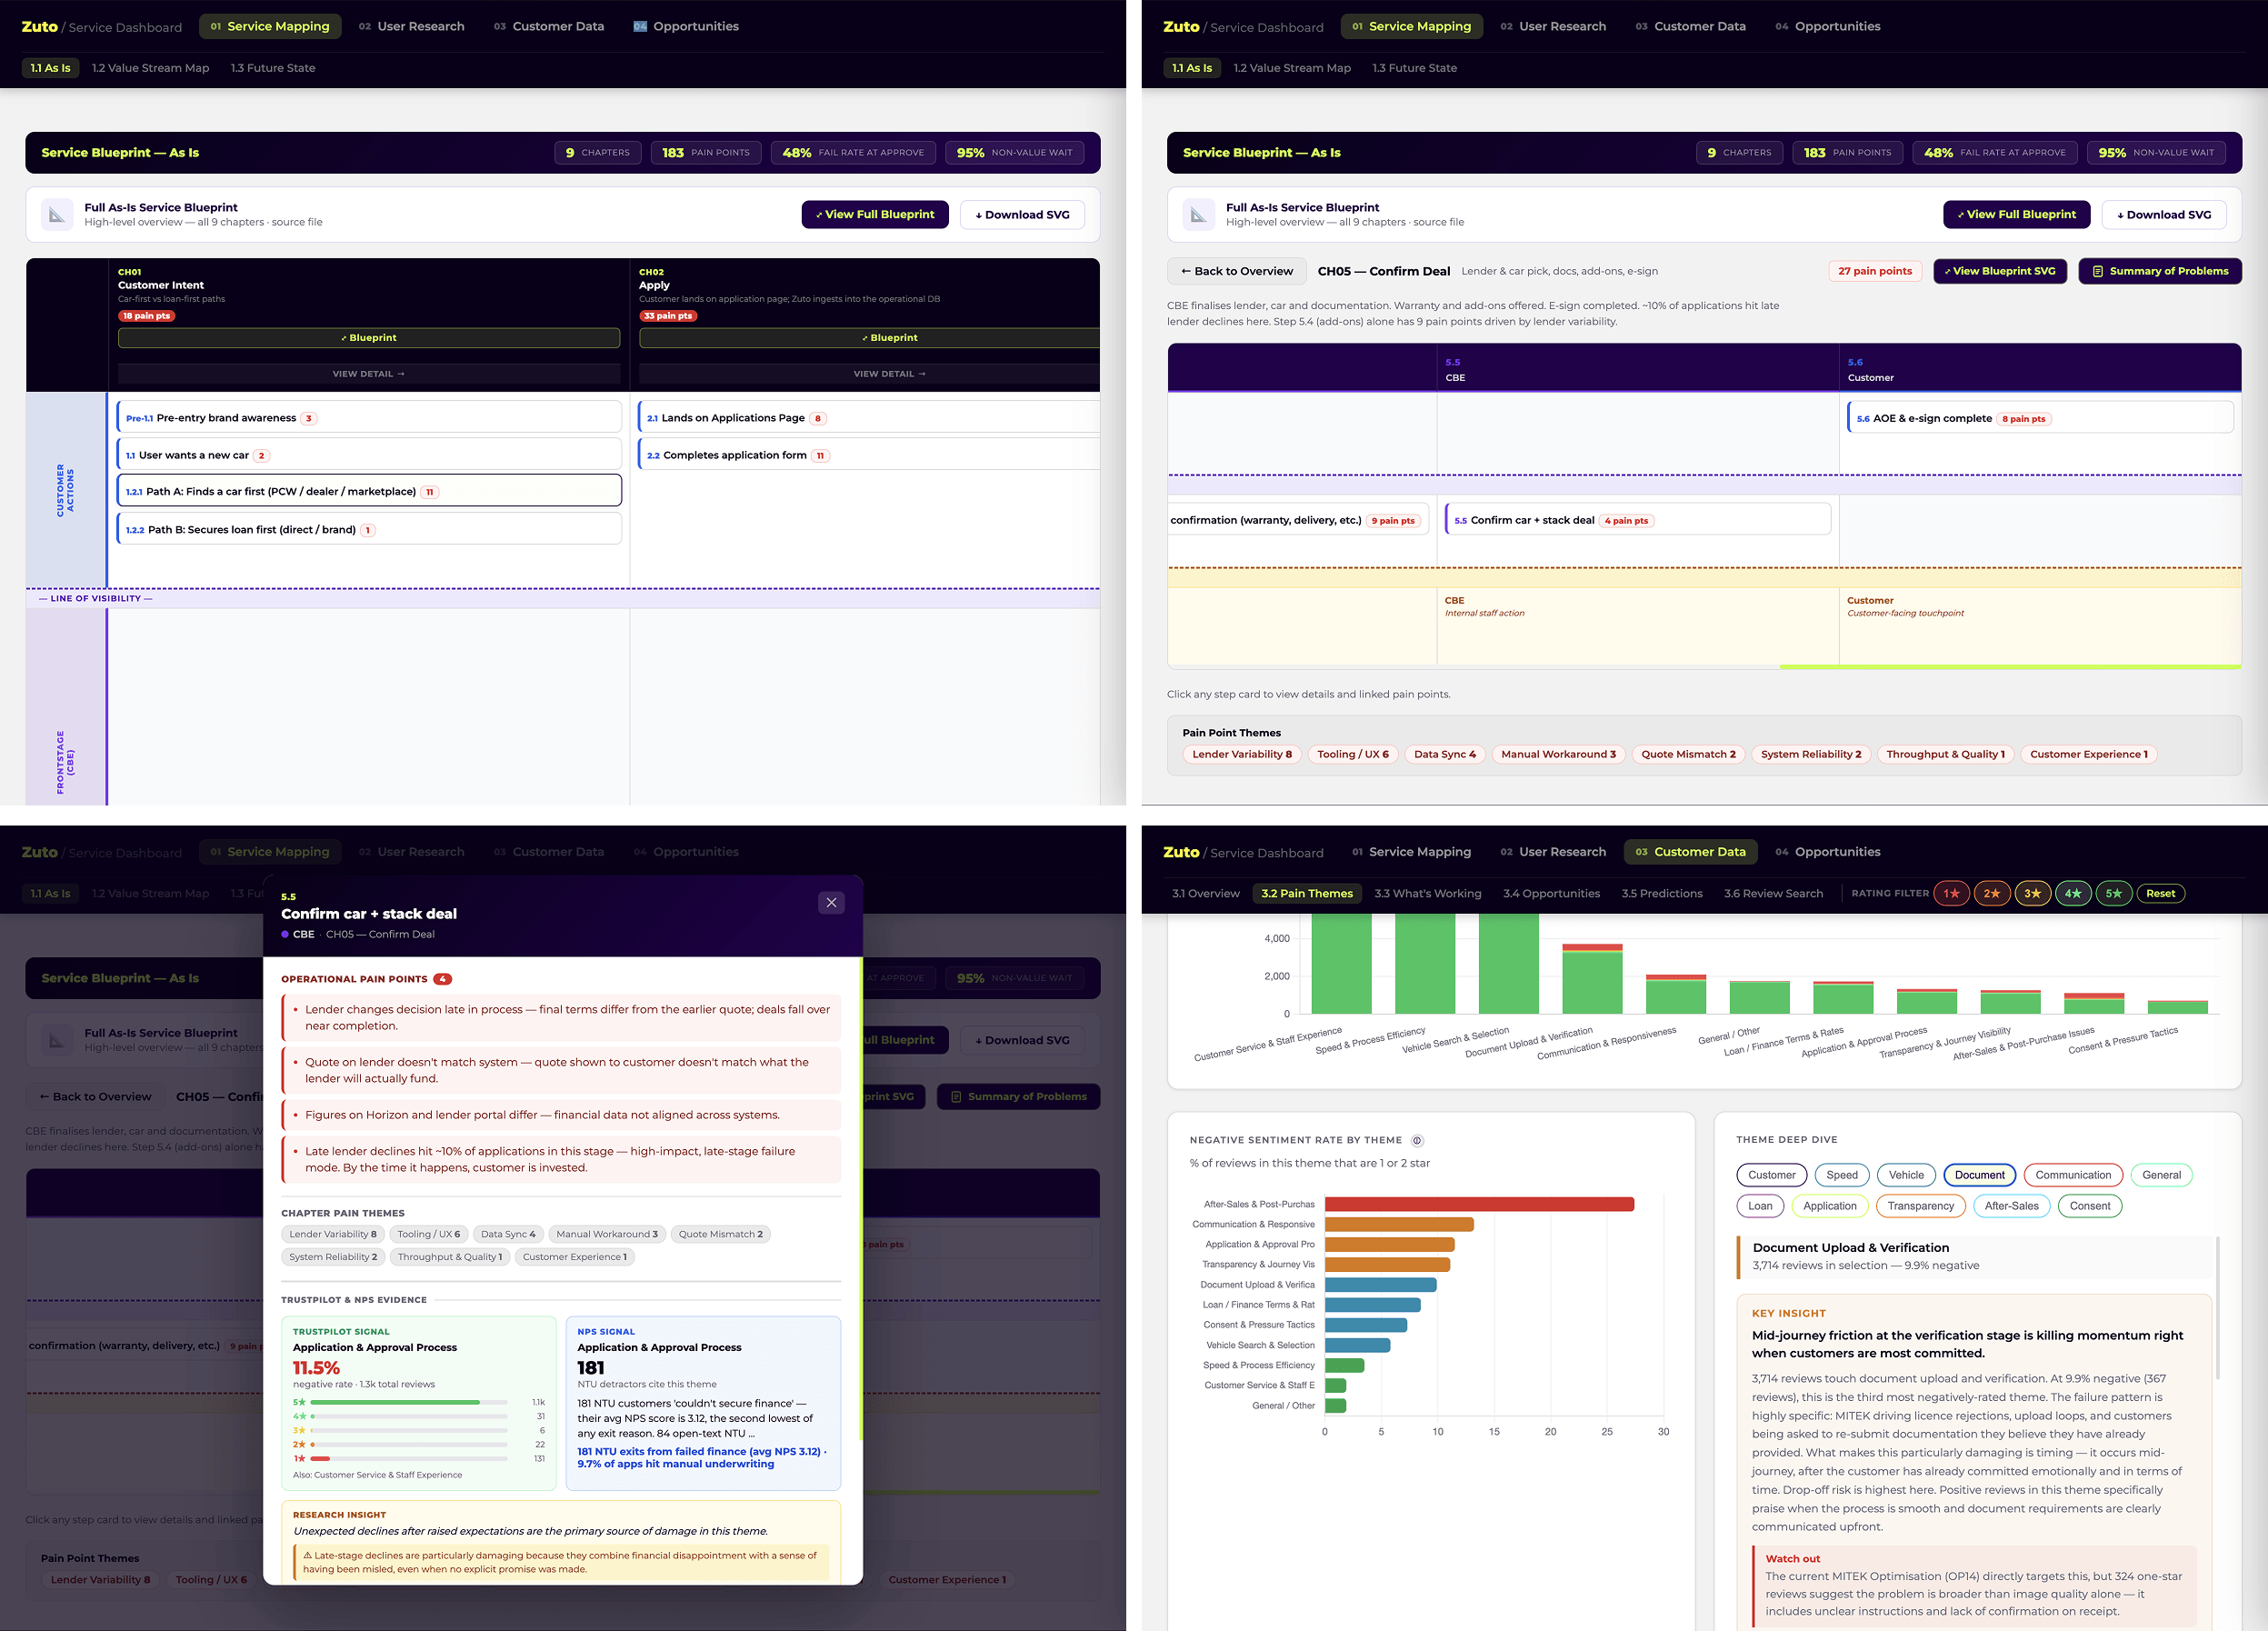
From the workshops, I built a comprehensive as-is service blueprint for Zuto's end-to-end journey. This was structured as a swimlane breakdown, presenting each layer of the service (customer actions, front-stage staff, back-stage operations, supporting systems, and pain points) in a format that Zuto's teams could read and use independently.
The blueprint was structured by chapter, mirroring the workshop structure, so that each department could navigate directly to their section while also understanding how their work connected to the broader journey. This was a deliberate design choice, recognising that a document that is not used is not useful. Making it navigable and contextually relevant to each reader increased the likelihood of it becoming a live working tool rather than a one-time deliverable.
Working with the wider team, we generated 25 distinct opportunities to improve Zuto's end-to-end service. These ranged from process-level quick wins to structural changes that would require significant engineering effort. The opportunities were drawn directly from the pain points surfaced in the workshops, ensuring that every idea was grounded in a real, identified problem rather than a hypothesis.
The breadth of opportunities reflected the complexity of the service. In a regulated financial services environment, opportunities must account for compliance constraints, lender relationships, and the sensitivity of customer data, and this shaped how the team framed and prioritised what was possible.
I took responsibility for writing and validating a third of the 25 opportunities, using an opportunity canvas format to give each idea a structured assessment. For each opportunity, I mapped out the core idea, the key assumptions that would need to hold for it to succeed, any technical constraints flagged by the engineering team, the potential impact on Zuto's key KPIs, and any risks or negative second-order effects that should be considered before implementation.
This rigour was particularly important given the financial services context. An opportunity that improves conversion but creates compliance exposure, or that speeds up one step while creating bottlenecks elsewhere, is not a genuine improvement. The canvas process forced clarity on what each opportunity would actually require and what it might cost.
One of the most distinctive contributions I made on this project was a quantitative analysis of Zuto's customer experience data. I analysed over 20,000 data points spanning a nine-month period, covering customer sentiment and satisfaction signals captured at various stages of the journey.
Rather than treating this as a separate strand of analysis, I mapped the findings directly back against the as-is service blueprint. This allowed me to visualise not just where customers were dissatisfied, but where in the journey that dissatisfaction was being generated and how it tracked across the end-to-end process. The result was a layered view of the service that combined the qualitative insight from the workshops with quantitative evidence of customer impact.
This kind of bridging between service design artefacts and operational data is not always part of a service designer's remit, but I saw it as essential for this project. In a financial services business where every touchpoint carries commercial and reputational risk, decisions made without data are harder to justify to leadership and to regulators.
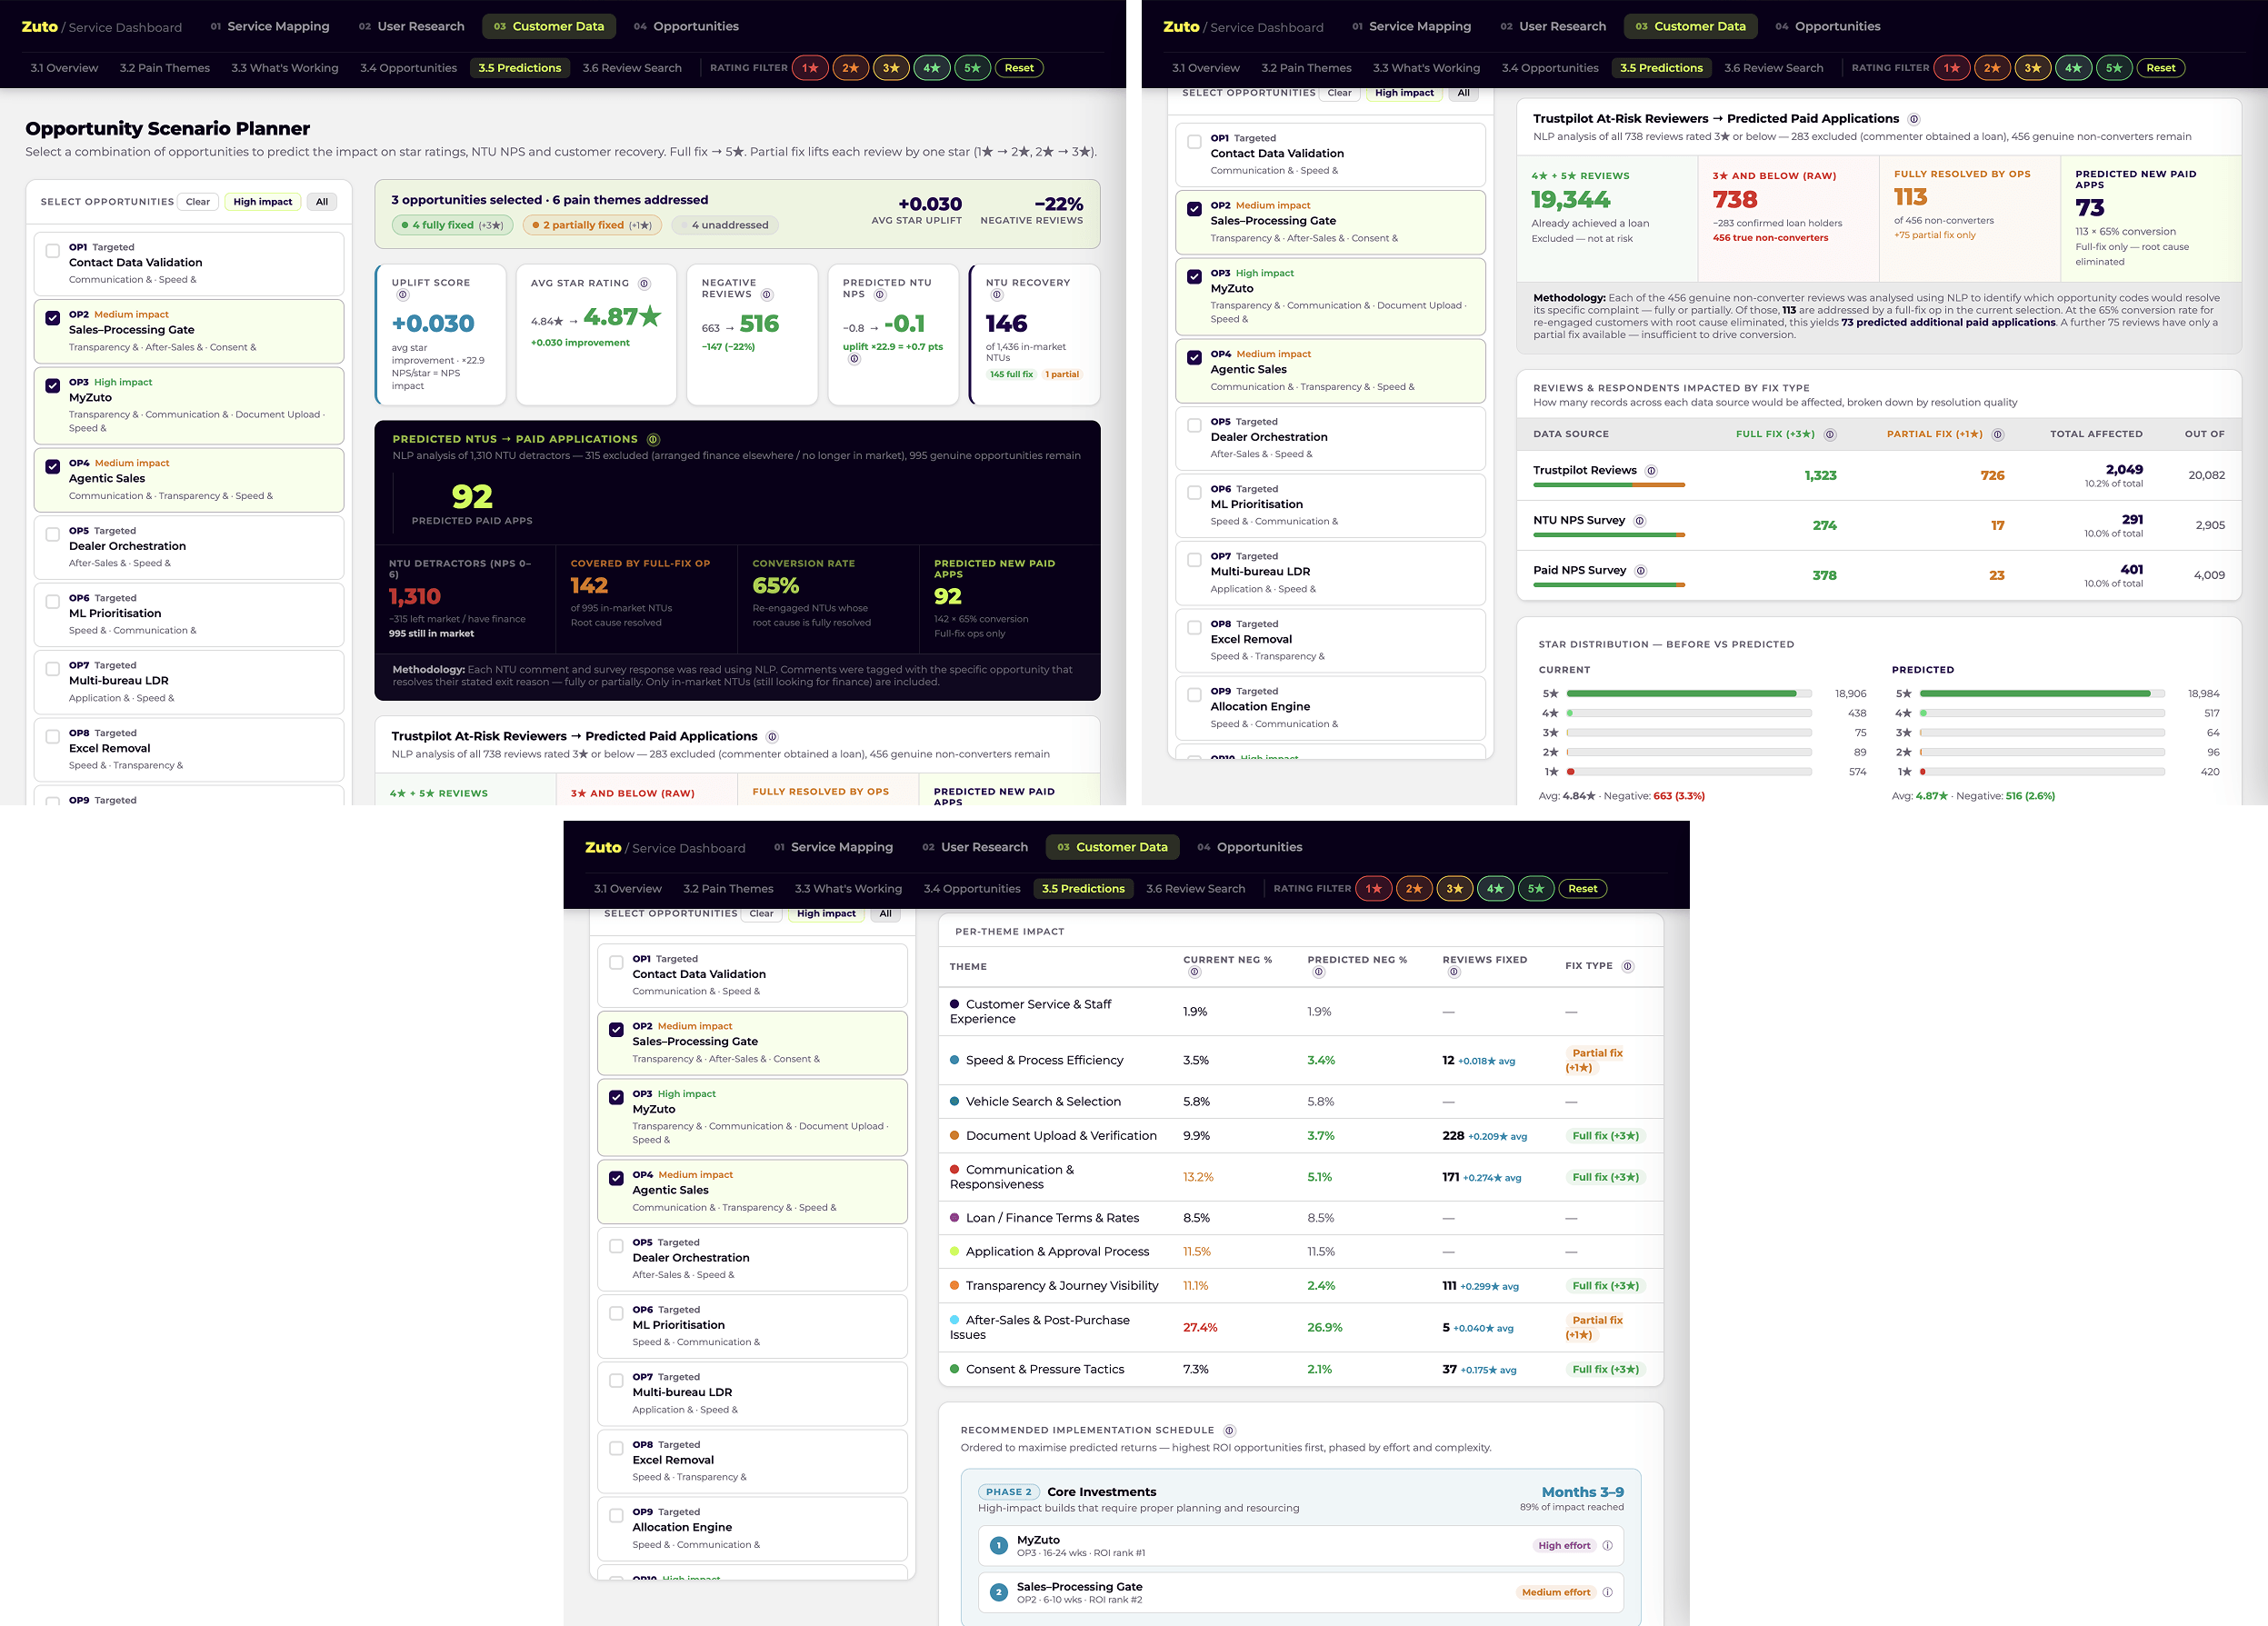
To help Zuto's leadership understand the potential value of the proposed opportunities, I built a custom predictive modelling dashboard. This modelled how customer experience data would change if the identified opportunities were correctly implemented, providing a forward-looking view of impact rather than simply a diagnosis of the current state.
Building this required me to work at the boundary of service design and data analysis, using Excel and Claude to generate and stress-test the model. I designed the dashboard to be accessible to non-technical stakeholders, translating complex modelling into a format that supported decision making without requiring the reader to understand the underlying methodology.
I created a future state service blueprint that visualised Zuto's end-to-end journey with all validated opportunities incorporated. This was designed as a companion to the as-is blueprint, allowing stakeholders to directly compare the current and intended future state of the service.
Alongside the future state blueprint, I built a heat map to visualise where across the journey the proposed changes would have the greatest effect. This gave the leadership team an at-a-glance view of which chapters would see the most significant transformation, helping to inform sequencing decisions and manage stakeholder expectations across departments.
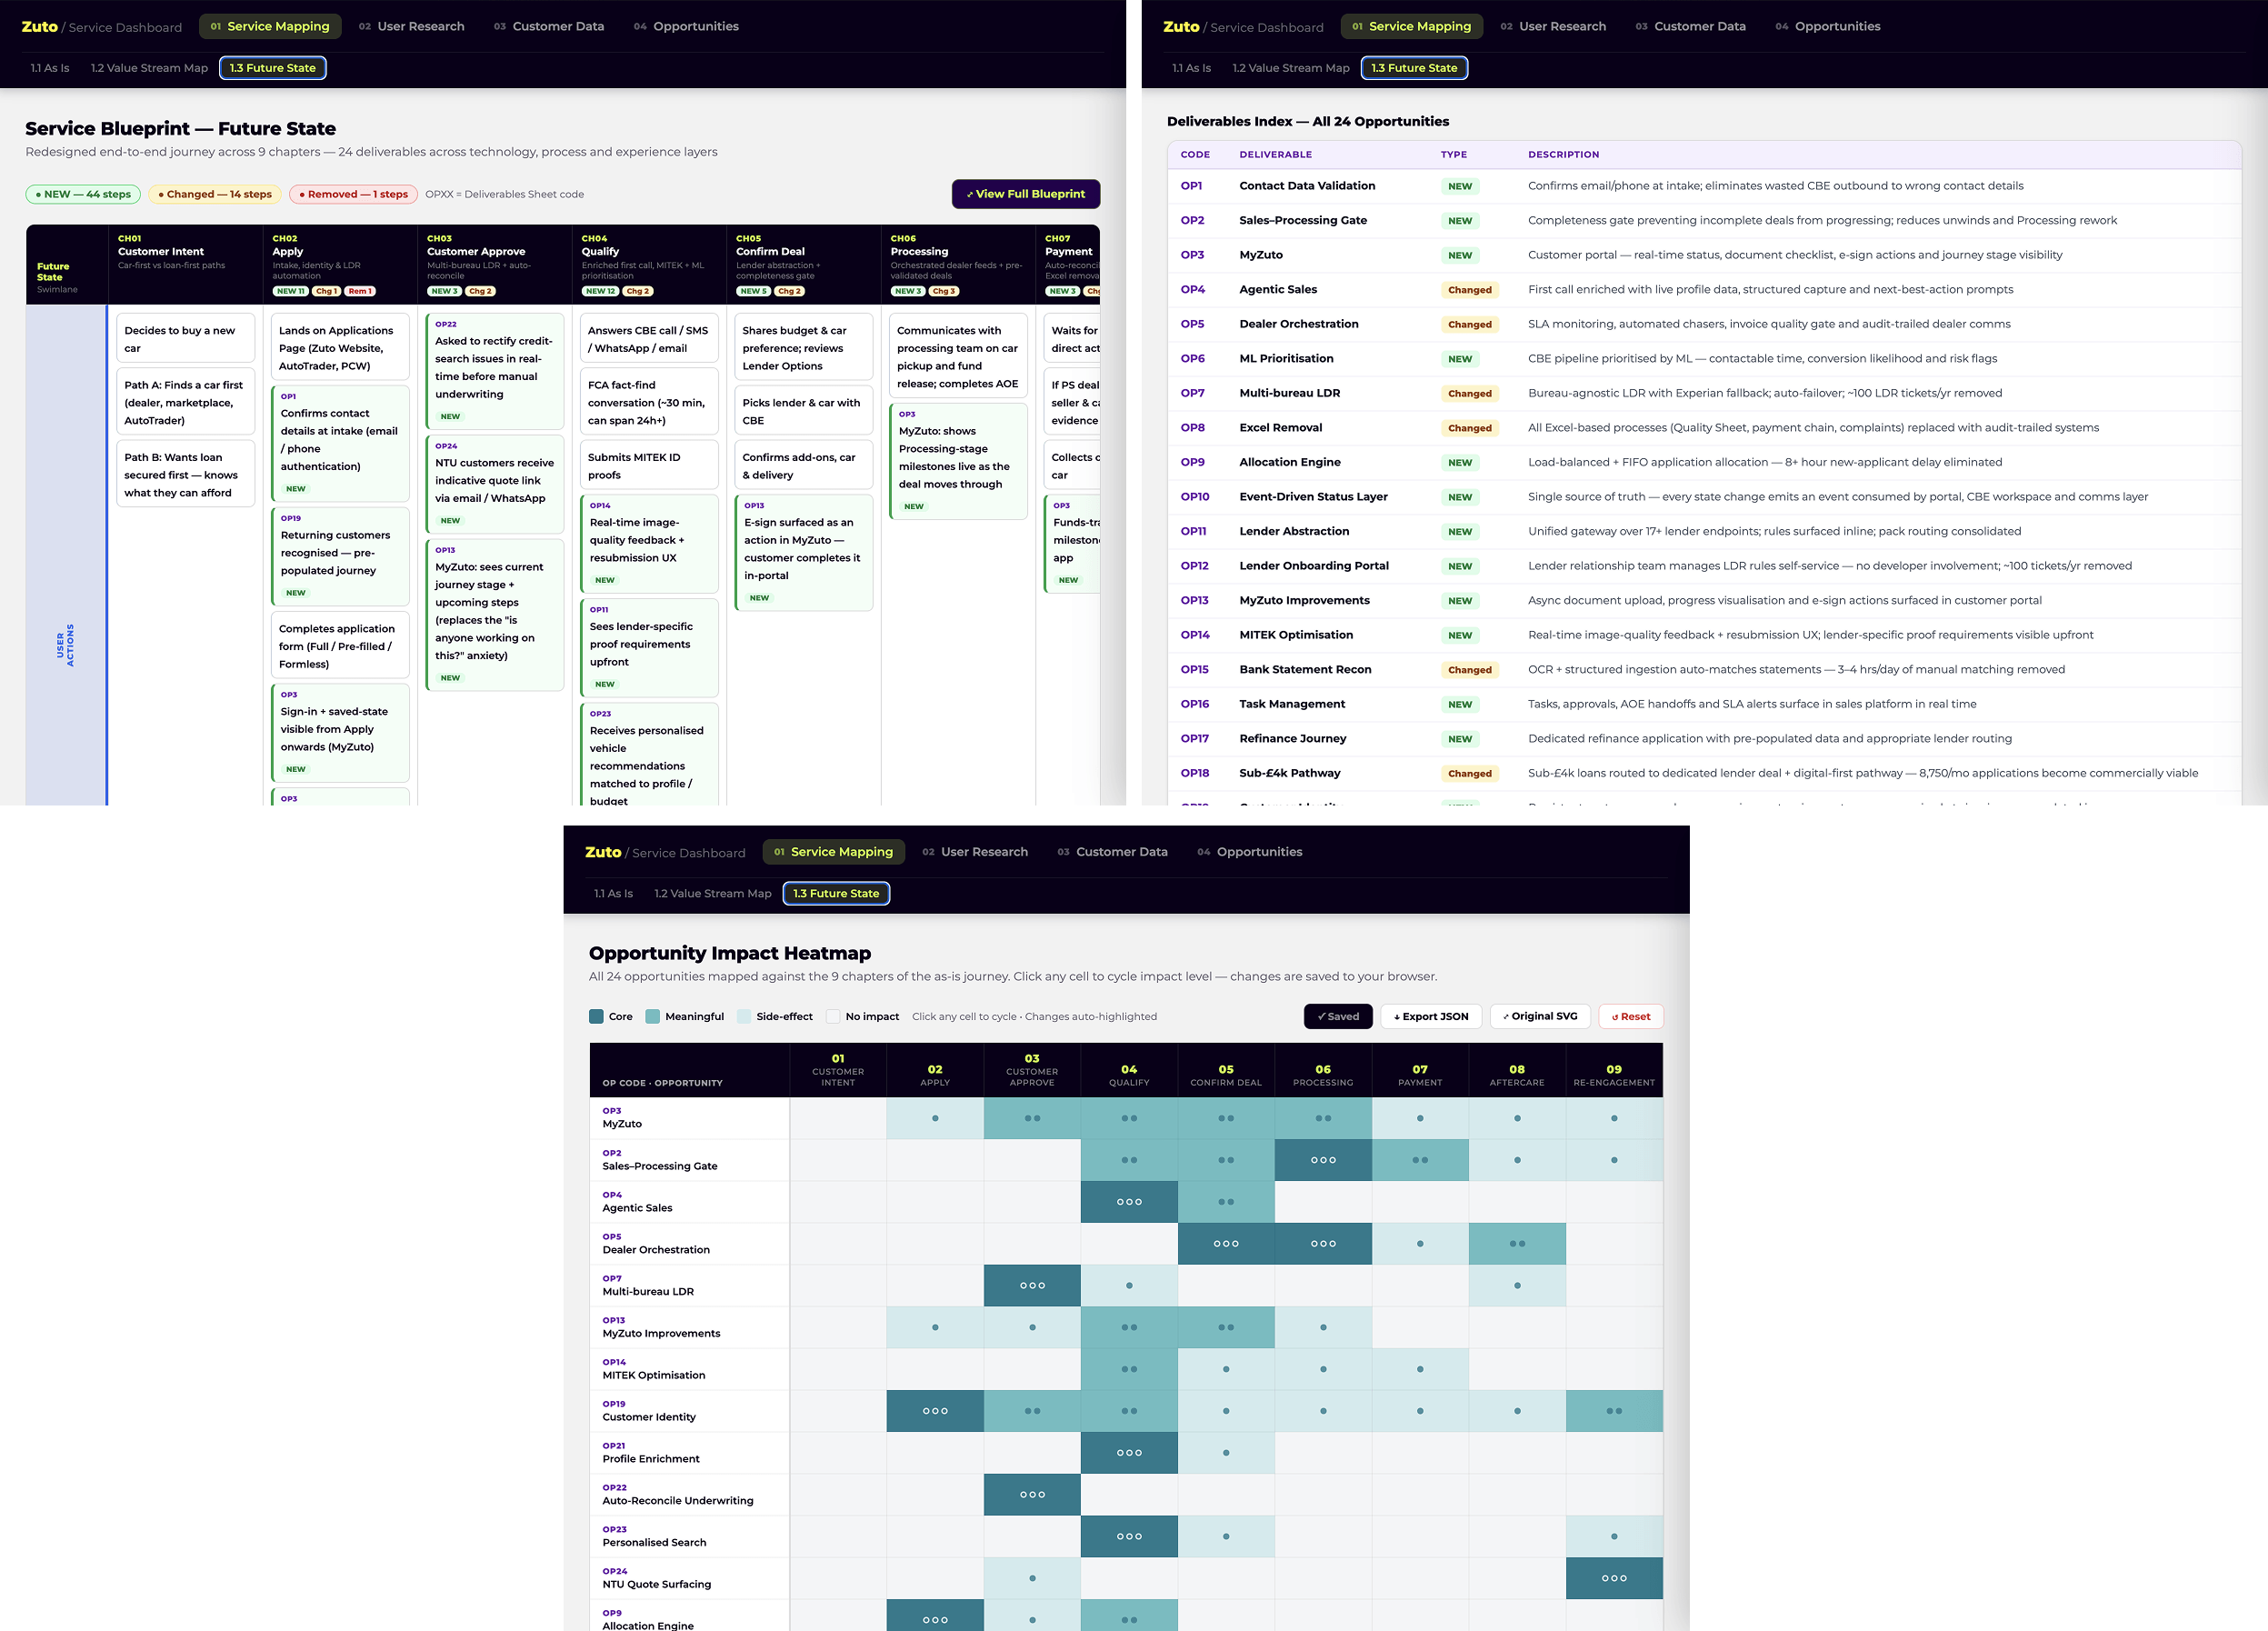
The final phase of the engagement brought the team together to produce a delivery plan for implementing the prioritised opportunities. I contributed to the sequencing logic, drawing on the heat map analysis to advocate for an order of implementation that would generate early customer experience wins while managing the complexity of larger, more systemic changes.
The delivery plan translated the strategic outputs of the previous phases into a practical roadmap that Zuto's internal teams could own and execute. Ensuring that a plan was not just created but was realistic and usable was a key part of the value delivered at this stage.
This engagement brought together a range of senior service design capabilities, applied consistently across eight weeks and multiple high-stakes outputs.
Working in financial services as a service designer surfaces tensions that do not exist in the same way in other sectors. The desire to remove friction from a customer journey must be balanced against the reality that some friction is legally required. Understanding this distinction, and being able to articulate it clearly in workshops and deliverables, was one of the most valuable skills I developed through this engagement.
The combination of qualitative and quantitative methods was a deliberate choice and one that I would use again in similar contexts. In a business where leaders are accustomed to making decisions based on financial and operational data, presenting service design insights in a quantified form significantly increases their credibility and actionability. The predictive modelling dashboard, in particular, shifted conversations from what should we do to when do we do it and what do we need to do it.
The project also reinforced the importance of designing outputs for their audience rather than for their completeness. A service blueprint that a business can navigate and use independently is more valuable than one that is comprehensive but inaccessible. Every artefact I produced on this project was shaped by the question: who will use this, and how?
This project demonstrates my ability to operate at the intersection of service design, data analysis, and strategic communication in a regulated, commercially high-stakes environment.


Designed with curiosity, built with purpose – I combine research-led insights with thoughtful design to create meaningful user experiences. Let’s connect and shape what’s next – available for freelance, collaboration, or a chat about design.
Connect on LinkedIn
